
|
|
 |
|
Back to Article List Detecting Intrusions with your Firewall Log and OsHids By Daniel B. Cid | cidd@nhlbi.nih.gov | www.ossec.net January 22, 2004 Introduction Many articles have been published about intrustion detection systems (IDSs), categories of IDSs (Network-Based, host-Based), IDS signatures, etc. But what I have noticed is that people always forget the basic methods of intrusion detection. They think that the only way to detect an attack is by using tools like Snort, Portsentry or any other commercial IDS. Actually, any device or software that is able to detect an attack (or system misuse) can be called an IDS. If you have a little shell script that looks for anomalies on your log files, you have an IDS (not very complete, but it is one). In this article we are going to talk about one of the basic, but powerful, methods of Intrusion Detection: Firewall Log Analysis. Although a firewall generates a lot of logs, being difficult to analyze, you can use the OsHids tool to monitor your logs (generating an easy to view log in html with an PHP interface) and help you visualize any attempt to bypass your firewall policy. Why do I want to use a firewall as an IDS?
Firewall Policy The scope of this article is not to help you to create your firewall policy or to configure your firewall, but to show an easy method to visualize its log. To accomplish that, I will use an example of a simple firewall policy to help you understand how it works. Simple Firewall Policy - Allowed traffic:As you can see, it is a very simple policy. We allow any internal traffic outside and only allow external (new) traffic to our Internet servers. Do you already have a firewall policy? If dont, you must start one. What kind of traffic is allowed to reach your internal systems? What kind of traffic can your internal users access? Your firewall policy will cover all these questions. Setting up your firewall With this policy in mind, we are going to build our firewall rules. In our example, we are going to use Iptables as our firewall. You can use any kind of firewall you want, but on the actual version of OsHids (0.2), it will only support Iptables to generate the html logs correctly. On version 0.2, it will only recognize a log as being from Iptables if it finds the string "Iptables" on the log and on the log type. If you have any other firewall and add the string iptables together with the log, it will be analyzed; but Im quite sure that it will not be correctly logged, because OsHids is set up to the iptables format (DST=, DPT=, etc). If you want help, send me some lines of your firewall log, I can add support to it. Before we continue, I want to remind you that everything that is not allowed, is considered possibly dangerous. If anyone is trying to access port TCP 110 on your web server from the Internet, and this traffic is not allowed, your IDS will not complain about it; but your firewall will. It can be a reconnaissance attack or someone scanning your hosts and looking for a vulnerable system. Its always good to have a complete vision about what is happening on the network. Below you can see our simple iptables rules. Some parts were stripped to avoid unnecessary information, but the most important part is in bold (about the log level and the log prefix). # Simple Iptables rules.Setting up syslog.conf (syslogd) Now we need to set up the syslog.conf. In this example Im going to send all kern.info logs (from the firewall) to our log server. On it, I will set the syslog to send all kern.info information to the file /var/log/iptables.log and configure the OsHids to analyze the logs. On the firewall I added the following line: kern.info @logserver And on the log server: kern.info /var/log/iptables.log Configuring OsHids After all other steps are completed; we can go to the log server and configure the OsHids. Its configuration is very simple and you dont need to compile anything (all code is in Perl). I will subdivide OsHids installation for easier understanding. *You must have perl (OsHids) and apache+php (php engine) installed on the log server. 1. Download OsHids: 2. Untar/Ungzip it: 3. Move the example 7 configuration dir to the default config directory: 4. Open the ./config/oshids.conf and choose your log dir. On step four, you need to make sure that you set up the syslogd to send all kern.info logs to the /var/log/iptables.log (or change it to whatever file you chose) and that the directory /var/www/html is accessible by Apache (everything will be inside /var/www/html/fw/). [root@logserver oshids-0.2]# cat ./conf/oshids.rules5. Copy the php engine to the specified www dir: 6. Modify your /var/www/html/fw/conf-web.php: In our case, the log dir will be the current directory, because we configured before the OsHids default dir to "$mylogdir="/var/www/html";", which means that all html logs will be stored on "/var/www/html/fw/Month-Day-Year". 7. Start the OsHids: And we are done with this part! Monitoring your logs With all the hard part done, we can move to the "easy" part (Im kidding, monitoring your logs will never be easy). You only need to point your browser to the IP address of your log server (or wherever you configured the OsHids) and to the directory that you choose. In our case, as we chose the directory /var/www/htdocs/fw/ (and the Apache Document Root was configured to /var/www/htdocs), we need to point our browser to http://logserver/fw/. I want to remind you that our PHP engine does not have any kind of access control, so anyone will be able to look at it. To improve its security, at least follow these recommendations:
Pict 1: Initial Page of the PHP engine 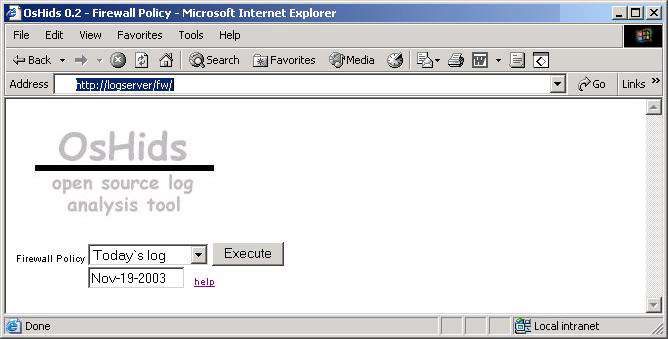 On the picture above (Pict 1) you can see the initial page of our PHP engine. You can choose to see "Todays log", "Yesterdays log" or any other days log you want (be sure to follow the correct format, as explained on the help page). After you choose the day, a new page will appear with the logs divided by TCP and UDP (only for that day). On each one you can see if someone tried to access a denied port. Look at the picture bellow (Pict 2); its easy to see that someone probably did a port scan on you (port 10,11,12,13,14,15,16, etc logged). Another important thing to remember is that you can receive a lot of information from ports UDP 67, 138, etc. You can tune your firewall to only log what is important. If you click on a specific port, you will see the page shown on Pict 3. There you can have more information about who tried to access this port, at what time, etc. If you need more information (TCP flags, MAC address, etc), you can click on the checkbox to view the complete packet information. Using this simple PHP engine (and OsHids) you can now monitor (on a daily basis) any attempt to bypass your firewall policy. All ports above 1024 will be logged as "other". Pict 2: Logs from a specific day 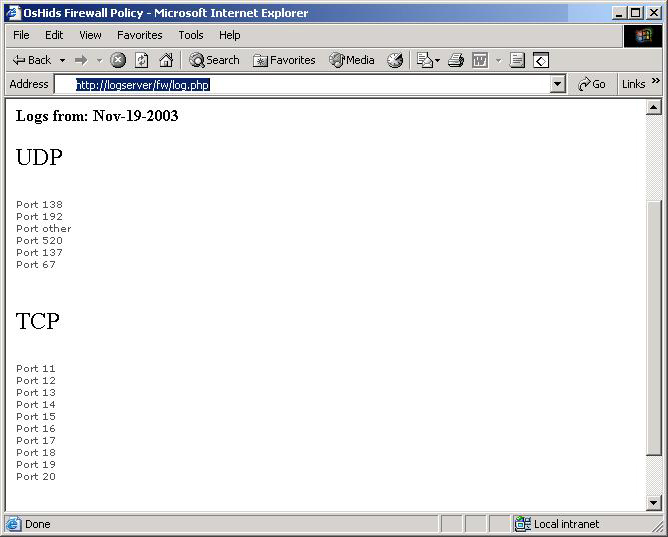 Pict 3: Logs from a Specific Port with the box checked (for more info) 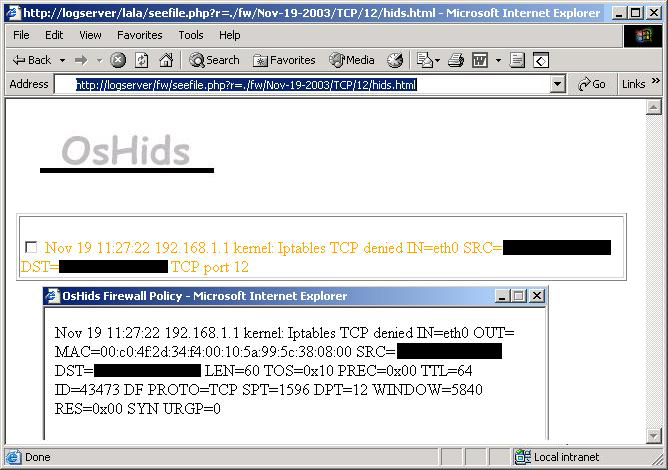 Summary The initial purpose of this article was only to show how to configure OsHids to analyze Iptables log, but I also added some other information about intrusion detection and Iptables (firewall policy) configuration to help the reader to understand the importance of log analysis. Take a look at the references for more information. References OsHids Web site OsHids on Sourceforge Log Analysis Web site Securing Apache: Step-by-Step Snort to Iptables FAQ: Firewall Forensics |
| Copyright 1997-2025 Relevant Technologies. All rights reserved | Legal and Privacy | Sitemap Email: info@relevanttechnologies.com | 8115 Maple Lawn Blvd, Suite 350, Fulton, MD 20759 |